Original research on how people answer video forms
We study anonymised data from forms on RecRam and publish what we learn about how people answer video, voice and text questions. Every report is free to read, and its charts and data are free to reuse.
- Free to read
- Charts you can embed
- Open data, CC BY 4.0
The State of Multimodal Form Responses 2026
What 8,058 form responses and 1,713 video answers on RecRam show about how people answer when a form lets them record. Six questions, each answered with its sample and its caveat.
- 20 min read
- 6 findings
- Charts and CSV data
- By RecRam Research
Six questions it answers
Charts and data for your own articles and decks
Every chart is a crisp SVG you can embed, and the numbers behind them are one CSV. Use them under CC BY 4.0: credit RecRam Research and link to the report.
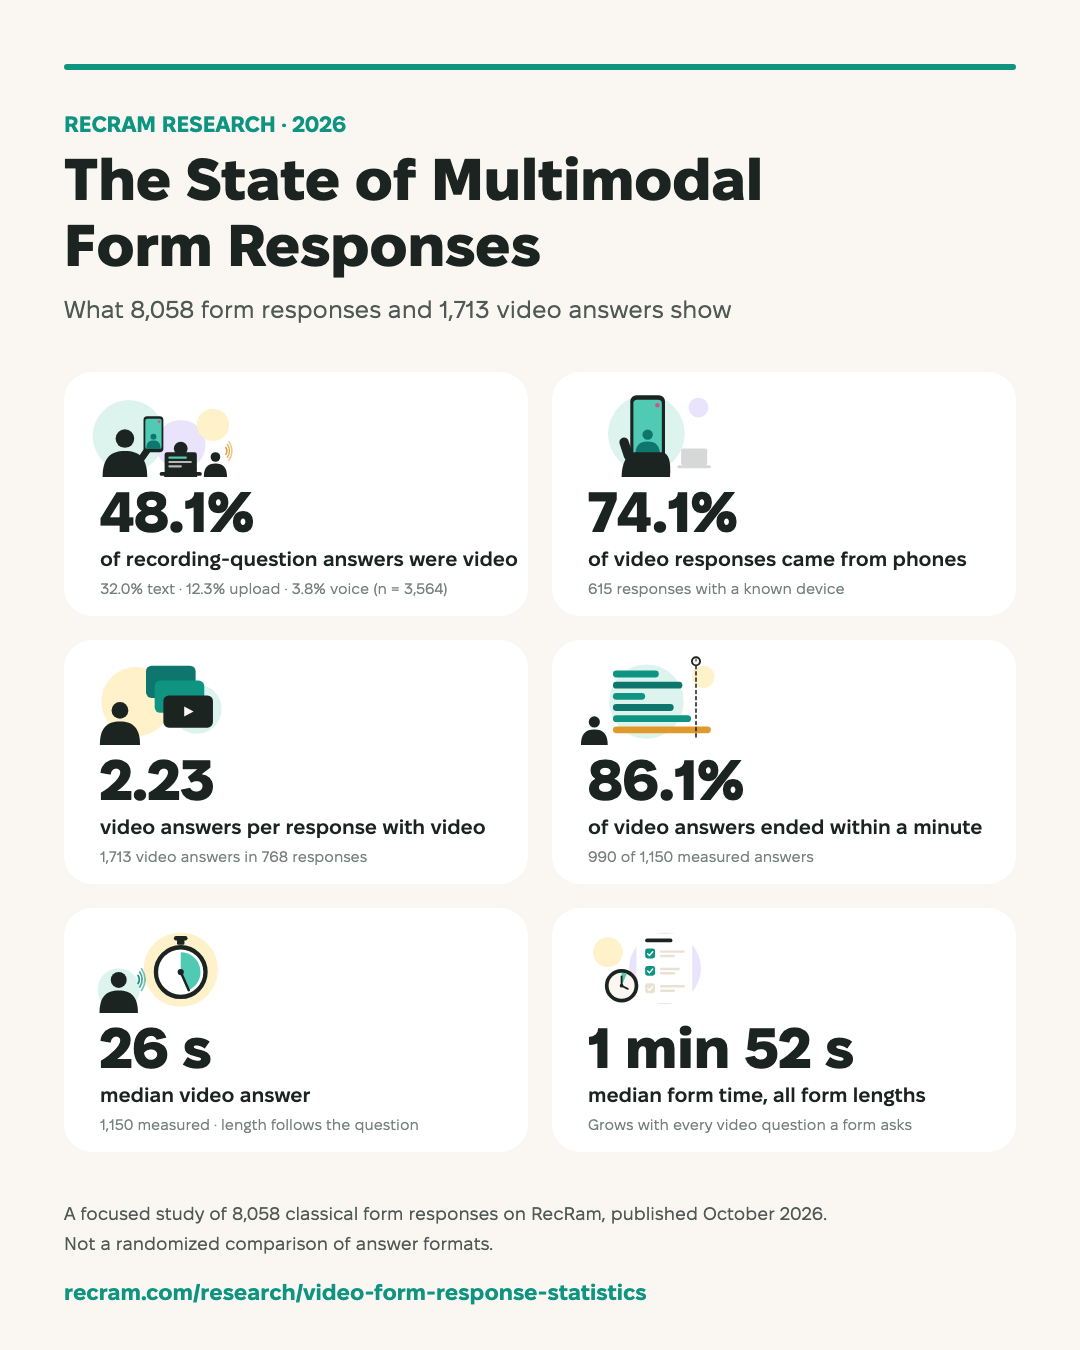 Key numbers infographicPNG · 1080×1350
 How recorder answers were storedSVG
 Most video responses came from phonesSVG
Every chart, the CSV and ready-made citations are in the report, with embed code you can paste into your page.
Cite & reuseNumbers you can check, not marketing claims
Real platform data
Built from anonymised, aggregated data from forms on RecRam. We never publish individual responses, and no customer can be identified.
Every number shows its base
Each figure comes with the sample it was measured on and the one caveat that has to travel with it.
Methods and limits in the open
Each report explains what we counted, what we left out and why, so you can judge the numbers for yourself.
Stable links for citations
Each edition keeps its own URL. New data means a new version, and links to an older one never break.
Turn the findings into better questions
Have a question data could answer?
Tell us what you would like to see measured about video, voice or text answers. Questions from teams help shape what we study next.
They won't type it.
But they'll show it.
Start collecting real feedback in video. See what your customers actually think and feel.